ROAS vs ROI to Measure Advertising Success
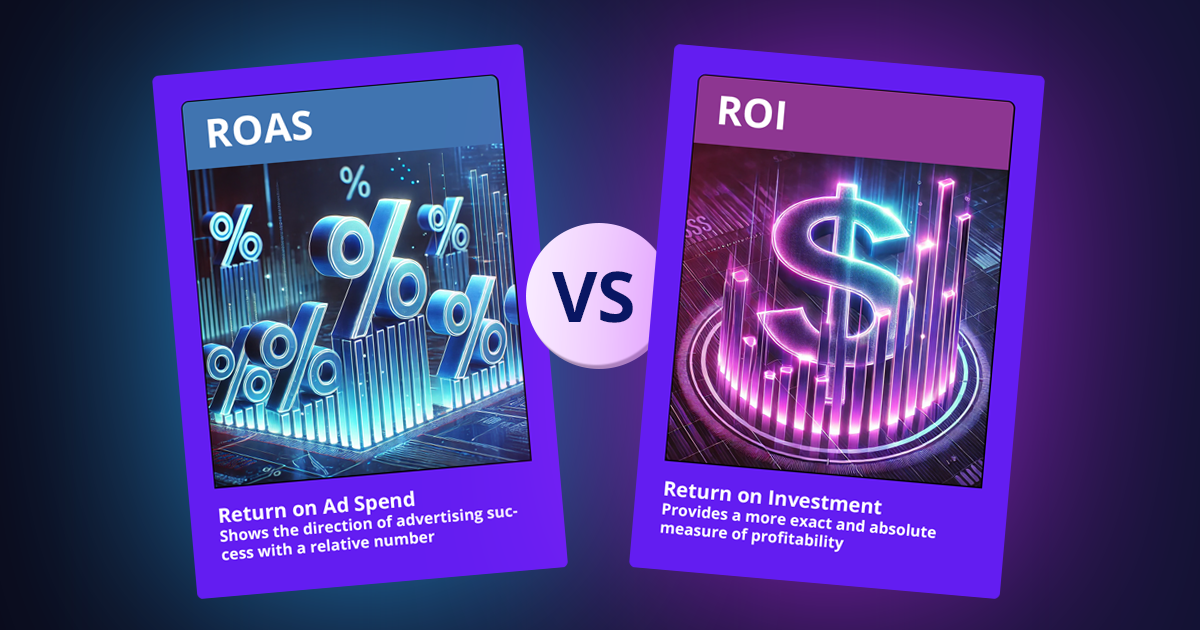
ROI and ROAS are two central and important metrics for measuring advertising performance. While ROAS (Return on Ad Spend) shows the direction of advertising success with a relative number indicating the revenue return for every dollar spent, ROI (Return on Investment) provides a more exact and absolute measure of profitability by factoring in all costs and showing how much net profit is achieved.
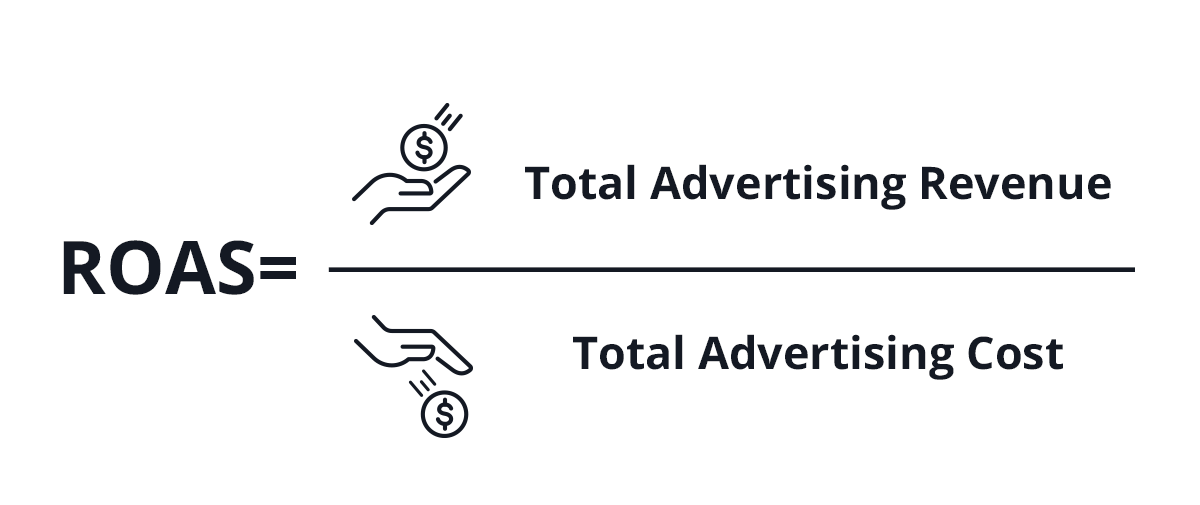
ROAS Calculation
Measures revenue generated per dollar spent on advertising, focusing on ad performance.
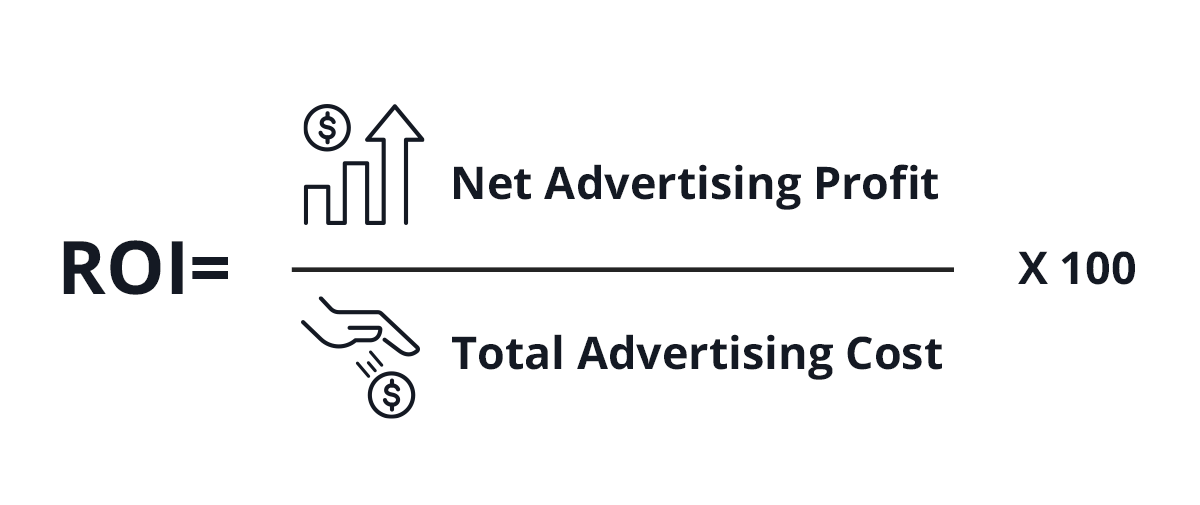
ROI Calculation
Examines net profit after deducting advertising and other related expenses, offering a complete picture of economic profitability.
Real-World Example: Using ROI and ROAS Together
SpecialGifts, a company selling gift vouchers. They spend $10,000 on an ad campaign and generate $50,000 in revenue. However, the company’s profit margin is only 10%. Here’s how the metrics compare:
ROAS Calculation
This means the campaign returned $5 for every $1 spent on advertising.
50,000 ÷ 10,000 = $5
ROI Calculation
Despite the high ROAS, the campaign resulted in a 50% loss because the revenue didn’t translate into profit.
((($50,000 × 10%) − $10,000) ÷ $10,000) × 100 = −50%
This shows the actual loss of $5,000, despite the positive ROAS.
This example highlights why relying on ROAS alone can be misleading. While ROAS measures revenue efficiency, it doesn’t account for profitability.
Or in other words, while a 5 to 1 ratio of ROAS can create a feeling of successful advertising, checking the ROI reveals the complete picture, which in this case is a $5,000 loss.
Optimal Use of ROAS and ROI
To increase advertising performance and profitability, ROAS and ROI must work together. While ROAS gives you immediate feedback on ad efficiency, ROI ensures that the revenue translates into real profit.
For advertisers, this means:
- Monitoring ROI regularly to understand profitability trends.
- Using ROAS for quick insights into ad performance.
- Combining both metrics to identify underperforming campaigns and optimize ad spend.
Advertisers should also consider changes in profitability stemming from factors like product margins or operational costs. Keeping your finger on the pulse with ROI ensures ROAS remains a reliable indicator of success.
Discover What Drives Profitability in Your Advertising
To create more profitable advertising, it’s essential to analyze the performance of different elements within each advertising source. Even within the same platform, components like campaigns or creatives can deliver varying results. By checking the different components rather than just the overall source, you can identify what performs well and what inefficiently uses your budget.
These are the main components that we will check to optimize the budget:
- Source – Start by comparing results across advertising sources like Meta (Facebook, Instagram), Google Ads, LinkedIn Ads, Bing Ads, Taboola, and others. Identify the platforms delivering results that align with your business goals.
- Campaign – Within each platform, campaigns may perform differently. Analyze the profitability of each campaign to allocate budgets effectively.
- Creative – Different ads trigger varying audience responses. A specific creative might attract a more relevant and profitable audience, while another could yield less effective results.
- Keywords – Particularly in Google Ads, measuring the performance of different keywords helps identify those that drive profit versus those that waste budget.
- Audiences and Ad Groups – Platforms like Meta allow targeting specific audiences based on interests, professions, and demographics. Certain audience groups may prove more relevant and profitable, saving time and resources by reducing interactions with less suitable leads.
- Medium – Compare performance across mediums, such as CPC (cost per click), email campaigns, or other channels you utilize for advertising.
Beyond these key components, consider additional factors like:
- Device type
- Geographic location
- Placement within the platform: For example, Meta allows you to see whether an ad appeared in Instagram Stories on mobile or in the Facebook desktop feed, offering granular insights into performance.
- Partner network placements (e.g., GDN, which is typically outside Google properties, or Audience Network on Meta).
- Specific articles in platforms like Taboola.
- Any other variable provided by your advertising platform.
Learn from Your Results
Every business achieves unique results from active and real campaigns. Some campaigns perform better than others, generating higher economic value. Understanding what works and generates higher profitability is essential for advertising success.
This process requires continuous analysis and refinement. Data-driven decisions based on real metrics, enable advertisers to make smarter, more effective choices that drive profitability.
We’re Here to Help
Leader simplifies the process of tracking and optimizing your advertising performance. With detailed data, you can see revenue by source, campaign, keyword, audience, creative, and more. This data empowers smarter Data-Driven decisions and increased profitability.
Start your free 30-day trial today: Try Leader Now.